The Sydney property market in 2017 Q 1 compared to 1990 and 2002 – “Those who cannot remember the past are condemned to repeat it”
April 30th, 2017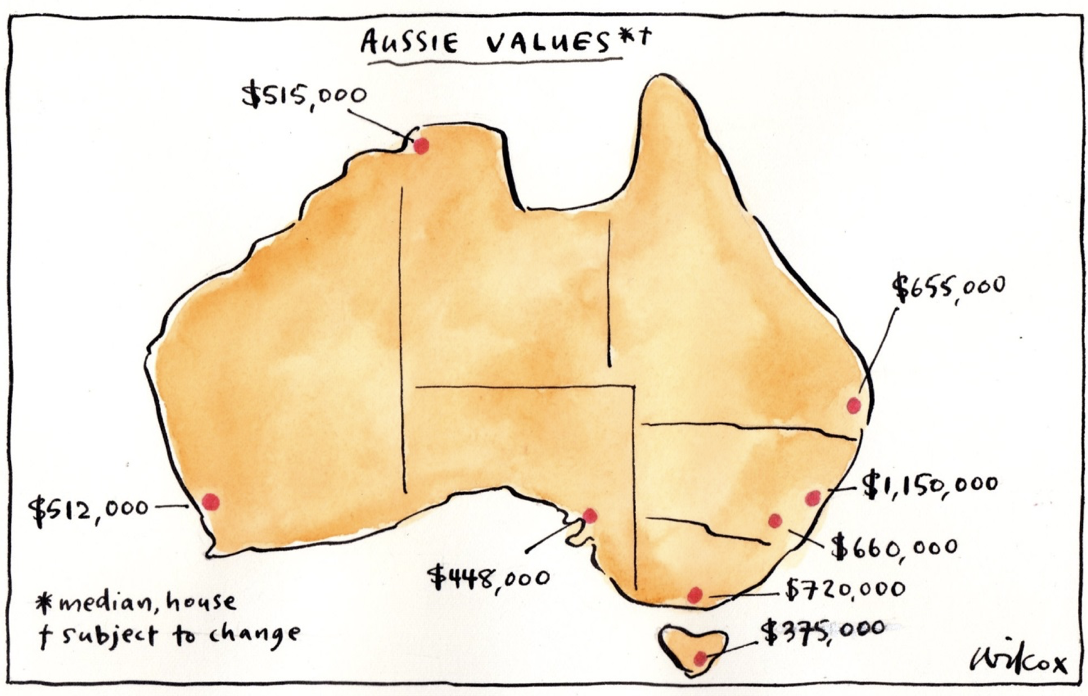
Buried under the avalanche of words written in 2017 Q1 about a bubble having or having not formed in Sydney’s property market, four distinct trends emerged which together, may have far reaching implications.
Our day to day experiences at several auctions and through many negotiations all over this town during that quarter inspired the comparisons drawn in this article between the present market and the markets in 1990 and 2002.
From the outset, we should say that unlike Dr John Hewson and ASIC Chairman Greg Medcraft who have said openly that the market is in the midst of a bubble, we are in the camp which eschews ‘bubble’ terminology as unhelpful sensationalism.
When a true bubble bursts, not so much as a faint smelling residue is left behind.
Even when the US sub prime bubble burst in 2008 triggering the GFC, the houses abandoned in its wake remained to be traded. No doubt during the mania some historians say spawned this distracting metaphor, tulips still grew in seventeenth century Holland.
The same holds true for Sydney. Whatever its imperfections and there are many, absent Armageddon, it will remain an attractive investment destination for foreigners and residents alike with a population and local economy growing and forecast to grow significantly over the longer term.
Eschewing a definition is one thing.
Recognising a serious market correction and the risk of negative equity in a home or property investment is another.
Even allowing for seasonal factors, two long weekends and a steady stream of rumours as to 9 May 2017 budget options being considered by the Federal Government to tackle housing affordability, strong signs that a correction was underway in Sydney emerged about a month ago.
In reminding readers of the parallels between now and 1990 as well as 2002, our hope is that both government and regulators do not overreact belatedly by trying to correct the RBA’s two profoundly mistaken 25 basis point reductions in the official cash rate on 4 May 2016 and 3 August 2016.
Both reductions not only compromised the helpful cooling effects of macro prudential measures taken in late 2014 by APRA, but until last month also turbocharged Sydney’s property market in 2016 Q 4 and for most of this quarter.
While the new ‘out of cycle’ interest rate rises likely blunted some of the stimulatory effects of those reductions, according to Steve Mickenbecker, head of research, product and strategy at Canstar, as reported in the SMH on 25 April 2017:
“Over the period there has been a 0.5 per cent reduction in the RBA cash rate. If you look at the various rates here, a number of them have gone up [out of cycle] but a lot of that clawing back has occurred in the last few months. Compared to the 0.5 per cent reduction there has not been a lot handed back.”
Little surprise therefore that the RBA’s Financial Aggregates data released on 28 April 2017 showed owner occupier lending increased by 0.6% in March 2017 and investor lending by 0.4%.
This article will be interested to see the RBA’s Financial Aggregates data for 2017 Q2.
Meantime, these were the 2017 Q1 trends discussed in this article:
- Sydney property buyers went on a spending spree
According to auction results published by Domain, the number of properties sold between the market opening in 2017 until 8 April 2017 compared to the same period in 2016, increased by a staggering 56%.
While on our calculations the number of properties listed for auction during the 2017 period to 8 April 2017 was 46% up on the same period last year, the gap between the two periods narrows once allowance is made for the early Easter in 2016 which saw just 27 properties sell on Easter Saturday 26 March 2016 compared to the 514 sold on 25 March 2017.
The net effect of these movements saw Domain’s average auction clearance rate increase by 23% relative to the same period last year.
Allowing for the usual lag before a cut in interest rates influences buyer behaviour, that buying spike was almost certainly caused by the two 25 basis point reductions mentioned earlier.
- Despite demand for property growing faster than supply, Sydney’s residential property prices rose slightly before flat lining this month
While properties traded on and off market were up on the same time last year, vendors were not rushing for the exits.
Instead, the increased turnover occurred at the margins with vendors meeting the market set by increasingly debt averse buyers.
While in our experience, some auction bidding and private treaty negotiations were spirited this quarter, there was nothing of the buyer frenzy or vendor robustness we encountered in 2016 Q4.
The sales activity in the well regarded Metropolitan Road, Enmore provides an ideal micro litmus test:
- on 7 December 2016, seven active bidders out of 10 registrants took the price of the un renovated and attached Number 14 to $1,960,000
- on 9 February 2017, the renovated, freestanding, better located and otherwise far superior Number 26 sold for just $2,005,000 after short stride bidding from a smaller pool of bidders
- on 22 April 2017, Number 11 was passed in at auction; a day when the inner west auction clearance rate maintained by local agents plummeted to 67%.
As this article goes to print, Core Logic has foreshadowed that its hedonic regression analysis to be released next Monday will show a “subtle fall in Sydney values” during April 2017 which will be the first such monthly decline since December 2015. Core Logic might have got it right this time unlike in times past: (AFR 23 September 2016).
If so and when compared to the lending increases in March 2017 discussed earlier, it will further support the inference that Sydney’s property market has reached the tipping point recently reported on by UBS.
- Many Sydney property buyers became increasingly concerned about their debt levels
While official loan figures for April 2017 are not yet available, anecdotal evidence suggested many Sydney property buyers became much more worried about debt in this quarter than they had been in the past.
In addition to our experience, this anecdotal evidence included a comment on 16 January 2017 by respected property analyst, Martin North from Digital Finance Analytics (DFA) that “we have had an avalanche of requests for further information on our recent research [on mortgage stress] which was published as a series of blog posts over the past couple of weeks.”
A constant stream of articles inevitably fuelled those concerns with their focus on:
- Australia having the second highest household debt to disposable income ratio in the world at 189% compared for example, to 70% in the early 1990’s
- the highest ever ratio of household debt to GDP at 123%
- falling real wages and
- the national unemployment rate having reached a 14 month peak of 5.9% with the number of under employed workers recorded in March 2017 being at an all time high of 1.1 million.
Headlines became increasingly sensational as the quarter unfolded and included:
- “OECD warns of ‘rout’ in house prices if investors head for the doors” (3 March 2017)
- “Why the RBA’s next rate rise will hit three times as hard as in the 1990s” (16 March 2017) and
- “This thing’s gonna blow.” (17 April 2017)
DFA’s analysis and numerous daily updates were widely reported in mainstream media including television.
For example, this passage in the AFR on 7 April 2017:
“Ask…Martin North what form the coming downturn in the housing market might take and “orderly” is not the description he uses.
Instead North anticipates a much more significant downturn in the investor-driven, debt-laden markets like Sydney…[and] says his view on the housing market has turned increasingly gloomier, Australia could be at the very early stages of where the US housing market was in 2008 before it crashed.
“Regulators have come to the party three or four years too late. They should have tackled negative gearing, not cut rates as much and focused on mortgage underwriting standards. Had they done so we would be in a position to manage the situation …I have a nasty feeling we are passed the point of being able to manage this. There are not enough levers available to regulators to pull it back in line. I can’t see anything other than a significant correction. It’s not a question of if, but when… “[m]y data shows the highest levels of immediate problems are not in the suburban fringe, but in the affluent suburbs, where people are really geared up with multiple properties.”
DFA’s opinions particularly resonated with Sydney property buyers because of their unique references to specific Sydney regions, suburbs and buyer demographics.
For example, this on 10 February 2017:
“[H]ouseholds in NSW are most exposed to a small rate rise, with 36% estimated to be under pressure from a 0.5% rise (explained by large mortgages and static rental yields)… Our master segmentation reveals that it is Young Affluent and Young Growing Families who are most exposed, followed by Exclusive Professionals. Some of the more affluent are portfolio investors, so are more leveraged, despite larger incomes.”
And this on 4 March 2017:
“A shake out in the property market would not be restricted to lower income areas and would include households in the trophy suburbs of Bondi and Lane Cove in Sydney…The common theme here is affluent households paying top dollar for apartments with big mortgages and the potential to be caught out by rising interest rates and flat or falling incomes. Even places like the lower north shore are being hit”…
- The RBA pivoted and signalled a new co ordinated approach between regulators
On 13 April 2017, Martin North rightly observed that “the latest Financial Stability Review from the RBA (the Review) has a different tone to it, compared with previous edition, because whereas they have previously played up the “cushion” some households have by paying their mortgages ahead, now they say one third of households have no buffer and are exposed to potential interest rate rises. What has changed is not the underlying data, but how it is being presented.”
What the Review actually said in the latter respect was:
“Prepayments on mortgages increase the resilience of household balance sheets. Aggregate mortgage buffers – balances in offset accounts and redraw facilities – are high, at around 17 per cent of outstanding loan balances or around 2½ years of scheduled repayments at current interest rates. However, these aggregate figures mask significant variation across borrowers, with available data suggesting that around one-third of borrowers have either no accrued buffer or a buffer of less than one month’s repayments. Those with minimal buffers tend to have newer mortgages, or to be lower-income or lower-wealth households”…
Dr Lowe foreshadowed APRA’s role during a speech given on 4 April 2017:
…[G]iven recent trends and the heightened risk environment, APRA announced some further measures last Friday.
There are two parts of APRA’s announcements that I would like to draw your attention to.
The first is the need for lenders to have a very strong focus on serviceability assessments…too many loans are still made where the borrower has the skinniest of income buffers after interest payments. In some cases, lenders are assuming that people can live more frugally than in practice they can, leaving little buffer if things go wrong. So APRA quite rightly has said that lenders can expect a strong supervisory focus on loans with a very low net income surplus.
The second area is interest-only lending. Over the past year, close to 40 per cent of the housing loans made in Australia have not required the scheduled repayment of even one dollar of principal at least in the first years of the life of the loan; only interest payments are required. This is unusual by international standards.
There are a couple of factors that help explain the popularity of interest-only loans in Australia. One is the flexible nature of Australian mortgages. Many people with interest-only loans make significant payments into offset accounts rather than explicitly paying down principal. This flexibility, which is of value to many people, isn’t available in most countries. A second factor is the taxation arrangements that apply to investment in residential property in Australia.
Last week APRA stated that it expected that new interest-only loans should account for no more than 30 per cent of the flow of new loans. It also stated that institutions should place strict limits on interest-only loans with high loan-to-valuation ratios.”
ASIC’s role was explained in the Review:
“The Australian Securities and Investments Commission has also announced further steps to ensure that interest-only loans are appropriate for borrowers’ circumstances and that remediation can be provided to borrowers who suffer financial distress as a consequence of past poor lending practices.”
This article’s concern about a regulatory over correction risk stems from sentiments like this as also found in the Review:
“The CFR [Council of Financial Regulators chaired by Dr Lowe and comprising the heads of the RBA, APRA, ASIC and the Australian Treasury] will continue to monitor developments carefully and consider further measures if necessary.”
As is the RBA’s fashion, the “further measures” were not specified. And that is what really concerns this article.
- Parallels with 1990 and 2002
- 1990
In his book “The Eighties: The Decade That Transformed Australia”, Frank Bongiorno describes the late 1980’s in these terms:
“The Australian Government…turned again to interest rates as its solution to an overheated economy. In the latter half of 1988, a powerful investment boom provoked an increasingly aggressive approach to raising interest rates by Keating…Hoping the economy would make a ‘soft landing’ when demand eased, they pushed up cash rates from 10 per cent in March 1988 to almost 18% in November 1989…[I]n cabinet, political hard heads like Graham Richardson argued that rising home – loan interest rates, unless checked, would kill the government.”
The official cash rate in November 1989 and December 1989 was actually 17.5%. While eye wateringly high by modern standards, as mentioned earlier, the household debt to disposable income ratio was around 70%.
These gyrations are depicted in this chart:
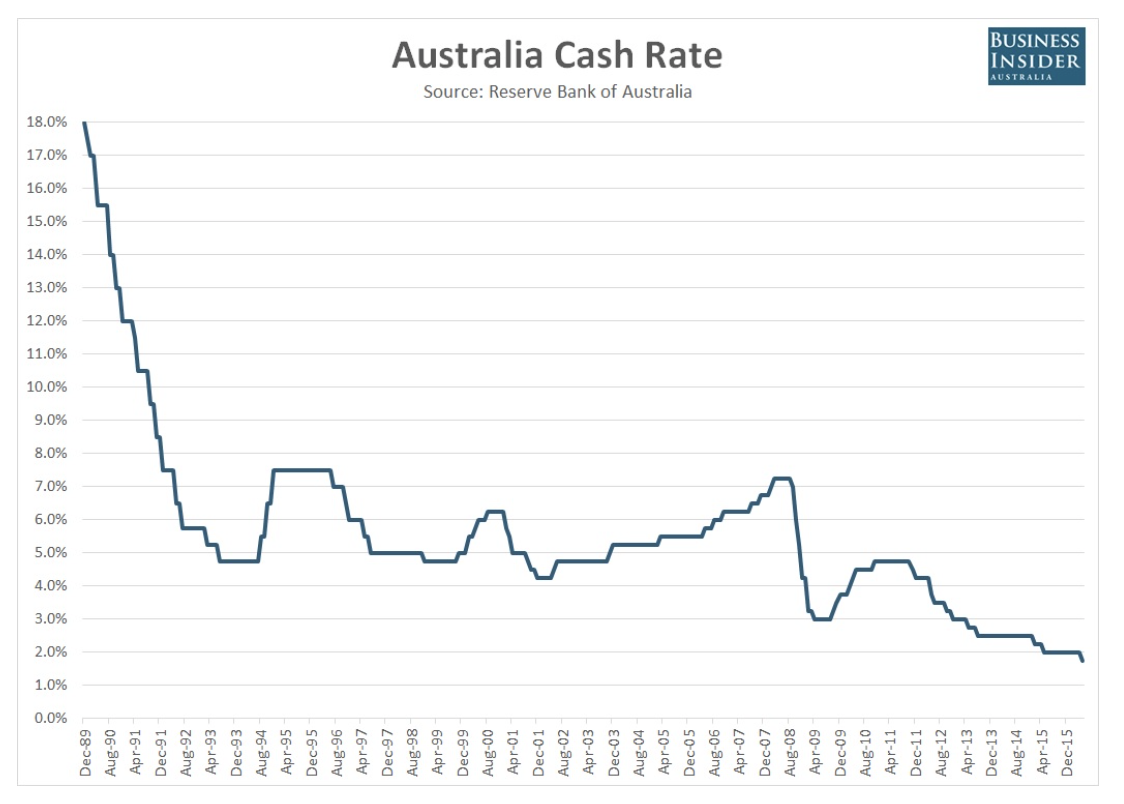
Those old enough to have attended auctions in 1989 Q4, will recall as we do that despite seven progressive interest rate rises in previous months, buyers were bullish, auction rooms overflowed with testosterone and the knock out final bid was a popular tactic.
Sound familiar?
Some of the differences between 1989 Q4 and 2016 Q4 included that in the former period there was no internet or capital gains tax discount and dummy bidding was the norm. On those rare occasions a property languished and there was no dummy bidder, it mattered not; the auctioneer would get things going simply by pulling bids out of a tree or thin air.
Even without the internet to spread anxiety at the speed of light, the effect of the November 1989 hike on property buyers was immediate and devastating.
The market stalled and buyers retreated in droves.
By July 1990, Australia was in a severe recession.
To quote Bongiorno again:
“ It…sent the economy into a downward spiral which Keating [in November 1990] famously described as ‘a recession that Australia had to have’.”
There were other, less direct parallels between 1990 and now: from August 1990 until the end of that year, a Middle Eastern dictator had the world on edge not with nuclear weapons but when he invaded Kuwait on 2 August 1990. The anxiety simmered for the rest of that year until January 1991 when the largest military alliance since WWII, including Australia, led by another aggressive Republican but Tweetless POTUS , invaded Saudi Arabia to start the first Gulf War. Massively increased globalisation since 1989 inevitably means that something similar or worse occurring in 2017 would have rapid and direct effects on all local property markets.
And on a smaller scale, Channel 10 was placed in administration for the first time…
This article hopes no such parallels are drawn in 2017 and beyond.
- 2002
On 5 Dec 2001, the official cash rate was a then relatively low 4.25% where it remained until 8 May 2002.
During that period, Sydney property buying resembled the frenzy in 1989 Q4 discussed earlier.
8 May 2002 marked the start of four consecutive 25 basis points rises in the official cash rate before landing at 5.25% on 3 December 2003 where, as the next chart shows, it remained for a record 15 months until 2 March 2005:
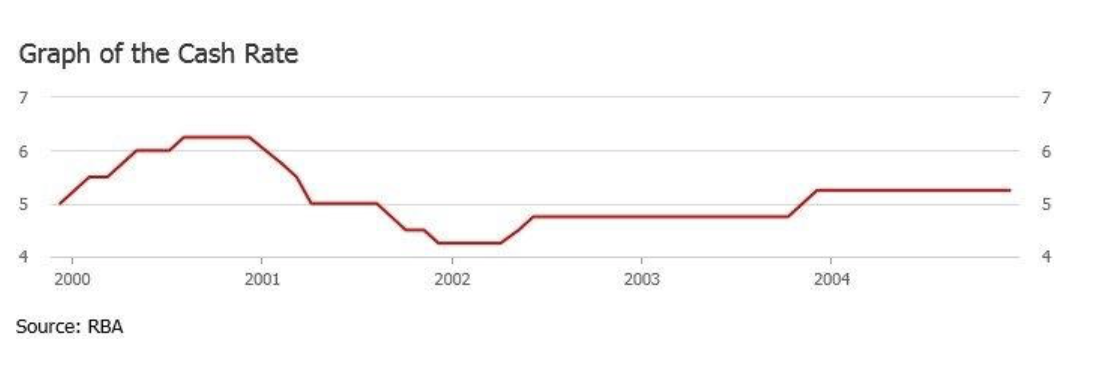
Then, as now, the household debt to disposable income ratio was much higher than 1990 and as such, also like now, the RBA’s fashion was to adjust the official cash rate in small increments or decrements.
Within six months those small increments had worked their way through the system so that by early 2004, properties whose on site auctions in 2002 once closed the street, were passed in with no bids.
All it took, as the chart above shows, was a sustained 1% increase in the official cash rate between late 2002 and 2004.
Sound familiar?
And in those days, there was an internet, the capital gains tax discount (introduced in 1999), underquoting was as rife as it is now and yes, there was running water.
- Conclusion
If the property market has already begun to correct, it is to be hoped that in executing any new measures, regulators remember the fragilities exposed in 1990 and 2002.
This article does not share Martin North’s pessimism.
The approaches to be taken by APRA as outlined by Dr Lowe are steps in the right direction.
If, however, the views discussed in this article prove wrong and Sydney’s property market resumes an upward and unsustainable trajectory, new measures should be considered including a higher interest rate for Sydney relative to other cities.
Some say that measure worked when it was tried in Auckland.
Others say it just transferred the problem to different regions.
If the figures in Cathy Wilcox’s cartoon are any guide, some other Australian cities might welcome a dose of monetary policy driven decentralisation.