October 2010 Sydney property prices – behind auction clearance rates lies a two speed housing market between $1 million and $2 million
October 30th, 2010
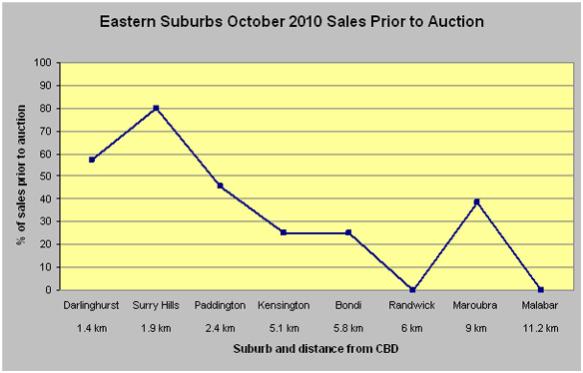
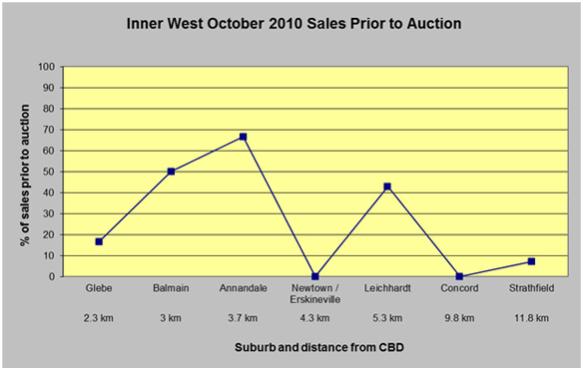
While auction clearance rates have definitely fallen this month relative to the levels experienced at the same time last year, the devil is in the detail underlying the published statistics. In an attempt to reconcile mainstream media reports which conflict with its day to day experience in the Sydney property market, Curtis Associates has analysed all reported sales transactions in the $1 million to $2 million bracket for October 2010 in the inner west and the eastern suburbs.
Those districts were selected because their higher sales volumes relative to other districts improved the reliability of any identified trends for extrapolation across the wider Sydney residential property market in the same bracket.
This analysis goes behind raw clearance rates data to focus on those properties which sold prior to their advertised auction dates. The reason for that methodology is simple.
A seller’s decision to abbreviate a marketing campaign by selling prior to auction is a back flip usually meaning one of two things: either the seller has received an over market offer that is too good to refuse or that, sensing the campaign has become a game of Russian roulette with the bullet being a likely absence of bidders on the day, the seller (usually on the advice of the same agent who suggested an auction in the first place), loses confidence and decides it is better to take and run with whatever money is on offer.
With the RP Data / Rismark Home Value Index released two days ago showing flat housing market conditions nationally and stringent credit approvals increasingly “subject to valuation”, the latter rather than the former is almost certainly the dominant motivation in the Sydney residential market.
Back flipping like this illustrates the “animal spirits” at work on the selling side of the Sydney residential property market – a concept defined by economists Professors George Akerlof and Robert Shiller on page 4 of their book “Animal Spirits” as…
“a restless and inconsistent element… [that] refers to our peculiar relationship with ambiguity or uncertainty. Sometimes we are paralysed by it. Yet at other times it refreshes and energises us, overcoming our fears and indecisions”.
In the present context, the more frequent the back flipping, the greater the downward pressure on Sydney property prices as buyers capitalise on sellers’ emerging lack of confidence – the element Akerloff and Shiller describe as being “the cornerstone of [their] theory”.
The results of this analysis in the $1 million to $2 million bracket are presented graphically below and show significant trends from which it is possible to draw clearer conclusions than have appeared in several mainstream media reports.
Sources: RP Data, realestate.com.au, Australian Property Monitors, domain.com.au, australianhousehunters.com.au, Curtis Associates Research
Trends:
- In the eastern suburbs, there was a strong inverse correlation between the proportion of properties selling prior to auction and the distance of those properties from the Sydney CBD.
- Although not as pronounced, there was a similar general trend in the inner west.
- This inverse correlation begins about four kilometres from the Sydney CBD and as this table comparing the underlying statistics in the suburbs in each district with the highest sales volumes suggests, strengthens the further the suburb is from Sydney’s CBD:
| Suburb | Properties listed for auction | Properties sold prior to auction | Percentage sold prior auction |
|---|---|---|---|
| Paddington | 22 | 10 | 45% |
| Strathfield | 14 | 1 | 7% |
Consequences and predictions for Sydney housing prices:
- Within a four kilometre radius of the Sydney CBD, the buyers’ market has arrived with a thud.
- For buyers of residential property in Sydney, some of the inner city glamour suburbs such as Paddington and Surry Hills are now fully priced and may yield opportunities for bargain hunters in the near to medium term as interest rates rise. Where buyers cannot be found (as in much of the Sydney prestige property market above $2 million), the same trends will lead to an increase in the number of properties withdrawn from their scheduled auctions.
- In the search for affordability, buyers are looking in areas beyond a four kilometre radius of Sydney’s CBD which, as the cycle matures, will reduce the number of bargains available in those areas.