Where’s the Sydney property market heading? The clues may lie in the last six months
April 14th, 2016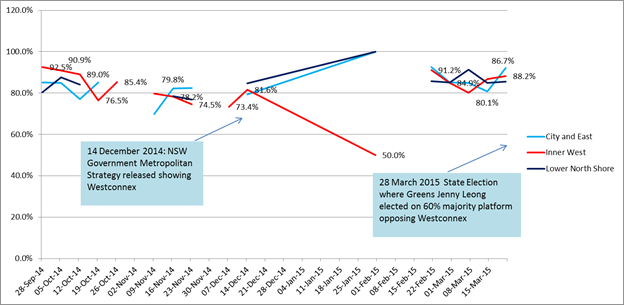
Quick Links to easily navigate this edition:
- The Property Cycle
- Interest rates and lending criteria
- Is Sydney’s residential property market at risk of being oversupplied?
- What about all the ‘Chinese’ buyers?
- The Baird NSW State Government
- Another Australian Prime Minister
Welcome to the maiden quarterly edition of CurtiseCall. As it covers two quarters from 1 September 2015, it is a bumper edition that will be longer than future editions.
The past six months in Sydney’s residential property market may have been more significant than is generally appreciated.
In addition to providing insights into the responses of buyers to certain stimuli and shocks, especially tightening lending criteria, certain events over those months exposed weaknesses in recent NSW State Government reforms and reinforced the need for further and urgent reforms to the way in which property is bought and sold in this State.
Other events have the potential to shape the medium to longer term nature and direction of the numerous sub and micro markets making up that market.
As with all disruption, those developments and events are likely to present as many threats to property buyers as they do opportunities.
And in the longer term, all of them may be sub ordinated to the challenging global economy with its deflationary bias, falling commodity prices and global bond yields, US and European quantitative easing, gyrating equity markets and weakening Chinese demand.
Key points discussed in this edition
- after a growth phase that started in mid 2012 and achieved unprecedented strength in the first half of 2015, Sydney’s residential property cycle began to correct in August 2015 before declining sharply in the December 2015 quarter to record the first falls in dwelling prices for three years
- as the main cause of that correction, the Australian Prudential Regulation Authority (APRA) emerged as a new major player with much stricter controls and a wide array of microeconomic tools at its disposal which may see its future influence and visibility surpass that of the Reserve Bank of Australia (RBA)
- the measures introduced by APRA suggest many borrowers are at the limits of their ability to service debt and that the duration and extent of this correction will be correlated to future interest rates which are under various pressures to rise and lending conditions which will continue to tighten
- although dismissed by many, the risk of a future oversupply of new medium and high density units increased with implications for the broader market
- the 2014/2015 pre occupation with Chinese buyers of Sydney property virtually disappeared especially at the prestige end of the market
- the Baird NSW State Government emerged as one of most significant single influences both in what it did and what it failed to do
- in the same way that Malcolm Turnbull’s appointment as Prime Minister coincided with the steepest part of the correction, the Commonwealth Government remains one of the least significant influences so far in 2016.
Discussion
(A) The Property Cycle
Despite their inherent unreliability, auction clearance rates are an often used metric in measuring market activity.
From the day the Sydney market opened in in 2015, the Saturday unadjusted auction clearance rates as recorded by the most widely cited Australian Property Monitors (APM) rose to unprecedented levels for most of the first three quarters of 2015.
Excluding three public holidays during that period, APM’s unadjusted auction clearance rates in the 22 weeks between 7 February 2015 and 1 August 2015 never fell below 80% with the weekly rate averaging 84.5%. The then highest ever clearance and listings rates of 88% and 1128 respectively both occurred on 28 March 2015 with the all time highest clearance rate of 89% being recorded on both 2 and 9 May 2015.
The period between 1 August 2015 and 26 September 2015 saw the beginnings of a correction with the weekly unadjusted auction clearance rates falling from a high of 80% on 15 August 2015 to a low of 70% on 26 September 2015 with the weekly rate averaging 74.6%.
By the time the market resumed after the Labour Day long weekend on 3 October 2015, the fact of a correction was inescapable.
From 10 October 2015 until the market closed on 19 December 2015, the weekly unadjusted clearance rate fell below 70% for the first time that year to 65% on 17 October 2015 and below 60% for the first time in three years to 59% on 7 November 2015. The weekly rate averaged a paltry 61%.
The other leading metric of market activity is changes to house prices over the December 2015 quarter. The most authoritative source in this respect is Catalogue 6416.0 Residential Property Price Indexes (RPPI) compiled by the Australian Bureau of Statistics (ABS). The RPPI is an aggregation of the House Price Index (HPI) and the Attached Dwelling Price Index (ADPI) defined as follows:
“Attached dwellings
Dwellings which share a structural component with one or more other buildings. This may include walls, ceiling, floor or roofing. For example, flats, units and apartments and semi-detached, row and terrace houses.
ADPI
A measure of the price change of attached dwellings…between two periods.
Dwelling
A suite or rooms contained within a building which are self-contained and intended for long-term residential use. To be self-contained the suite of rooms must possess cooking and bathing/shower facilities as building fixtures.
HPI
A measure of the price change in all established detached houses…between two periods.
Established houses
Detached residential dwellings on their own block of land regardless of age (i.e. including new houses sold as a house/land package as well as second hand houses).”
The ABS reported on 22 March 2016 that:
“[t]he RPPI for Sydney fell 1.6% in the December quarter 2015. This follows rises in the September 2015 (+3.1%) and June 2015 (+8.9%) quarters. The index rose 13.9% through the year to the December quarter 2015.
Over the December quarter 2015 the HPI fell 2.1% and the ADPI fell 0.8%. This is the first negative growth for RPPI, HPI and ADPI since the September quarter 2012.”
Price movements in the March 2016 quarter will not be known from that source until the next quarterly series is released on 21 June 2016.
According to Core Logic RP Data (which provides data to the ABS), Sydney dwelling values in that quarter relative to the last quarter rose 2% suggesting a rebound in growth in the early part of 2016.
In our opinion, any rebound in the first quarter of 2016 was mostly caused by the market being propped up by a shortage of housing stock as vendors withdrew in response to downbeat mainstream commentary. We doubt the rebound will be sustained.
Core Logic RP Data however, maintains that in March 2016 that “[t]he most substantial lift in residential property listings has been in Sydney, where listing numbers are now 19.2% higher than at the same time last year”.
We disagree strongly for three reasons.
First, a chorus of complaints from selling agents all over Sydney that housing stock levels, especially in the inner suburbs, are at unprecedented lows. Some are saying openly it is the worst quarter they have experienced in a decade.
Second, that view is inconsistent with the latest Housing Boom and Bust Report 2016 published by SQM Research which, on page 19, concluded that “[Sydney’s real] estate listings remain at near all time lows” .
Third, APM’s Saturday listings data records that the average number of listings in the March 2016 quarter was in fact 18% lower than the average for the same quarter last year and 21% lower than the average of the last three quarters of 2015.
A fortuitous case study involving houses rather than units illustrates the interplay between macro trends such as these and considerations at the micro level and which are at the heart of the property adage that the ‘money is in the buying’.
9 Park Road, Marrickville is a modern and well finished semi detached house with three bedrooms, two bathrooms and a garage; one of its most important attributes being its freestanding aspect/orientation along the northern boundary.
Following robust negotiations, it was bought off market in the middle of the last quarter of 2015 for 14 October 2015 for $1.64 million.
Eleven days later, the other semi of the pair at 9A Park Road was advertised for sale with an asking price of $1.675 million. Being built at the same time and by the same builder it is identical to its neighbour except for its south facing aspect and has a close neighbour on that boundary.
Reflecting the dip and slight rebound between the two quarters, number 9A was marketed at that price for 153 days before selling on 24 March 2016 for $1.65 million after a resurgence of interest from some buyers after Easter.
Assuming a 5% differential in value between the two properties for their differing boundaries (which is conservative and could easily be more like 10%), that puts a notional retrospective value on number 9 of $1.558 million as at 14 October 2015. At $1.64 million for number 9 on 24 March 2016, this equates to a notional on paper gross capital gain of 5.3% in five months; 2% of which might be attributable to the rise in the macro market recorded by Core Logic RP Data and the remaining 3.3% attributable to good buying at the micro level.
The fortuity of this small anecdote lies in the fact that it involves two substantially identical properties (except for their aspects) with each selling in the two relevant successive quarters. It is therefore almost as close as possible to a litmus test of true conditions in that sub market in each quarter and of the buying opportunities that can be exploited as flagged earlier in this article.
(B) Interest rates and lending criteria
The correction which began in that last quarter of 2015 resulted from a shock to the system. As the numbers show, it was a major shock; one which has achieved, unsurprisingly, hardly any mainstream attention.
What caused it?
As the official cash rate had not changed since 5 May 2015 and out of cycle increases were relatively confined, it was not the RBA.
The answer is APRA and specifically, the measures which its General Manager, Heidi Richards in a speech given on 18 March 2016 described as “APRA’s deep dive into lending standards”.
Starting in December 2014, APRA required lenders – technically referred to as Authorised Deposit Taking Institutions (ADI’s) – to become stricter in assessing the capacity of borrowers to service and repay their debts. A letter sent in December 2014 to all 17 major lenders and three sub brands confirmed APRA’s expectation ADI’s would impose interest rate buffers of at least two percent above the current loan rate and set a floor of 7%. Restrictions were also expected to be imposed on the length of interest only loans and more conservative ratios applied to net income available to service new loans after taking into account existing loans and living expenses.
An essential part of APRA’s strategy was the use of four hypothetical borrowers to assess the effectiveness of the measures it had introduced.
This further comment from Heidi Richards confirms the impact of these measures:
“Between 2014 and [September]2015, the maximum loan sizes that could have been extended to our four hypothetical borrowers declined by, on average, around 12 per cent for investors and 6 per cent for owner-occupiers. The actual change for individual ADIs was greater, up to 25 per cent in some cases…To conclude, APRA’s deep dive into lending standards has accompanied a significant change of practice by ADIs throughout 2015. ADIs have made tangible progress in meeting APRA’s expectations in this area, although there is still further work to be done. Debt serviceability assessments are now both more prudent and more consistent across ADIs than they were in recent times (emphasis added).”
The correlation between the timing of these measures and the start of the market downturn in August 2015 is irrefutable.
There was no doubt at the coalface where complaints by selling agents about sub $1.5 million investors dropping out because they “couldn’t raise the finance” suddenly became notorious – a perception later confirmed in these ABS findings for the quarter up to 31 March 2016:
“For established houses… in Sydney… between $700,000 and $1.4m contributed most to the fall [in values]…and [f]or attached dwellings, the negative growth …was [most] seen…between $420,000 and $850,000”…
Anecdotal evidence during that quarter suggested that above $1.5 million where debt can be a lesser consideration for many buyers, price falls were confined to sub prime properties with the prices of superior or unusual offerings plateauing rather than falling in response to more muted buyer enthusiasm than earlier in the year.
The speed and severity of the reaction up to $1.5 million is alarming and suggests that without APRA’s intervention, Sydney’s property market had moved into dangerous territory.
Amongst other things, APRA’s intervention exposed that many borrowers were at the limit of their ability to service new loans and with low incomes growth, that ability may come under pressure if and when interest rates rise.
Tested another way:
- what would have happened had APRA not intervened?
- what would it have said about the RBA?
- would the RBA have been forced to lift the official cash rate to the detriment of the broader economy?
In contrast to the RBA whose principal weapon is the macroeconomic official cash rate, these events have shown APRA to be able and willing to deploy an effective range of targeted microeconomic initiatives.
As likely as this is to continue, so too is the likelihood that APRA’s influence and visibility will surpass that of the RBA in this sector.
(C) Is Sydney’s residential property market at risk of being oversupplied?
Here, we are referring to a possible over supply of medium to high density residential units rather than detached houses.
This topic is not only important per se but also because of the interdependence between it and other topics discussed in this article.
It is impossible not to notice the number of residential buildings currently under construction all over Sydney especially around existing and proposed railway stations.
According to the Rider Levett Bucknell (RLB) Crane Index for Q2 2016, the number of erected cranes on Sydney multi storey residential building sites since Q4 2015 has increased by 44.8% from 165 to 239 spread through 83 suburbs.
On any view, that is a mammoth increase especially over such a short time frame.
Will this undoubted construction boom lead to an oversupply?
Mainstream commentary dismisses the suggestion with the mantra that all this supply has met pent up demand after years of underbuilding and will be satisfied by Sydney’s burgeoning population growth. It asserts that unlike other cases of proven oversupply such as Melbourne’s Docklands, there is no present evidence of rising rental vacancies or falling rental yields. Reference is also made to the latest ABS quarterly figures showing a dip in construction approvals, indicating that in any event, the boom has peaked.
Other, and in our view more considered, commentary disagrees.
Foremost amongst the fewer dissenting voices is Dr Nigel Stapledon of UNSW from whom further commentary on this topic can be expected shortly.
Whilst there is little disagreement with the idea of previous underbuilding, that demand, if it did exist, has surely been met not only by completed new developments but also by the many vacant rooms and space which existed (and according to some, still exists) in already built dwellings.
The second ‘burgeoning population growth’ limb which is central to mainstream analysis must be questioned.
Whereas the Plan for Growing Sydney released by the NSW Department of Planning and Environment in December 2014 predicts Sydney’s population will grow by 1.6 million people in the next 20 years, ABS demographic data for the September 2015 quarter in fact confirms a continuation of a national trend towards a slower population growth rate to just 1.3% per annum which is the slowest such growth rate since the June 2011 quarter.
Driving this downward trend is a very sharp decline in net overseas migration which is now at its lowest level since September 2006. Putting that rate in the further perspective of recent history, it is 46.9% lower than the growth rate in December 2008.
Compounding the national trend in New South Wales, for which Sydney is obviously the main proxy, interstate migration from that State is now at its highest level since March 2014. Over the September 2015 quarter, New South Wales experienced a net loss of 7,451 people to other States.
And all of these trends are accelerating.
Illustrating the interdependence flagged earlier, those trends can be expected to accelerate at an even greater rate if, for example, the Commonwealth repels foreign buyers of new stock or the New South Wales Government imposes taxes making it more expensive to hold property in New South Wales relative to other States (or across the Tasman) and/or fails to implement the right urban mix policies, provide the right public transport infrastructure and public schooling for Sydney (both of which also involve the Commonwealth) and resolve the controversy about lockout laws in a way that ensures a vibrant and safe night time economy re affirming Sydney’s role as an international city.
Reconciling the opposing views on the question of oversupply or not requires an appreciation of the timing differences involved. Given the long lag between approvals and commencements and the fact that many approved projects never commence, the former cannot be relied upon to assess the existence or otherwise of a present or medium term oversupply risk. The same applies to the many Sydney residential projects now in the concept design stage; major examples of which include Eveleigh Carriageworks, Parramatta Road, Rozelle, The Bays Precinct, around the proposed Sydney Metro Station at Waterloo and the Randwick Newmarket site.
How best to assess such a risk is beyond the scope of this article.
The real concern is the likely demand, including rental demand, for the expanded current pipeline of commenced projects. Even assuming no present rising rental vacancies or falling rental yields (which is both optimistic and already contrary to fact in some suburbs), that may not be the case when all projects in that pipeline have been completed.
Who cares we hear you say? “I would never buy a box in the sky. I think places like Green Square are the slums of the future.”
Whether that is the case or not, all Sydney property buyers should care.
The answer involves more interdependence : if the demand for these units bought off the plan has fallen by the time those contracts are due to be settled, they may be worth less than the agreed purchase price leading both to contracts not being completed or to borrowers with negative equity in their property. Both outcomes would in turn place further funding cost pressures on the banks leading to the risk of higher interest rates being passed on to those other property buyers. With household debt now being at unprecedented high levels and given the reaction to APRA’s tightening, the market’s ability to absorb that oversupply as happened most recently in Pyrmont, may be severely tested.
Alternatively, it could provoke a credit freeze from which no one benefits.
The issue is no longer just one for the future. As recently reported in the Fairfax media, the risk of oversupply has already seen the ANZ, AMP and NAB re rate the risk profile of many Sydney suburbs. The NAB recently published a list of 54 Sydney suburbs requiring borrowers to fund a minimum 20% deposit. It is perhaps unsurprising that investor loans in January 2016 were down 20% from their previous peak.
Given the lag between approvals and commencements discussed earlier, it is therefore a legitimate concern that 14 of those suburbs are included in the 83 suburbs mentioned in the latest RLH Crane Index. They are:
- Sydney (including Millers Point and South Sydney)
- Arncliffe
- Wolli Creek
- Ryde
- Chippendale
- Lidcombe
- Baulkham Hills
- Auburn
- Homebush
- Granville
- Parramatta
- Hurstville
- Lakemba and
- Putney
For the many developers who have paid premium prices for sites and need to sell at premium prices, there could be serious consequences of any reduction in demand which for other developers next in line, could mean longer term buying opportunities.
As industry veteran Lyn Shaddock observes in his recent Property Secrets memoir:
“ …A lot of the investment is from outside Australia, by people who have not experienced the fall in values of previous cycles…In every down cycle people say “This one is different”. I disagree…Foreign capital will only stay while it can foresee profit. The moment that perception changes, panic sets in and the capital goes to where it believes profit can be made…in most cases the decision process is drive (sic) by the desire to protect capital. The rush for the exit usually means bargains”.
(D) What about all the ‘Chinese’ buyers?
Whilst this will be referred to in a future CurtiseCall once the latest Foreign Investment Review Board Annual Report (FIRB) has been analysed, it is worth noting that this topic which so dominated the headlines 18 months ago and led to a Parliamentary Inquiry, no longer makes the headlines.
Some attribute this to a reduction in Chinese demand as a result of changes recommended by that Inquiry as well as a slow down in the Chinese economy and the imposition of controls limiting outflows of Chinese capital to preserve asset values.
Anecdotal evidence from around Sydney is consistent with there having been a reduction in demand from Chinese buyers particularly at the prestige end of the market, but also in the middle tier north western suburbs of previous strong Asian demand such as Cheltenham and Beecroft.
Reduced demand for new apartments would of course exacerbate the oversupply risk discussed earlier.
Perhaps contributing to any such slow down is the data matching currently being undertaken by the Australian Taxation Office (ATO) extending to transactions up to 32 years ago and which might lead to significant numbers of enforced property divestitures as a result of non compliance with FIRB’s requirements
If so, the Commonwealth and/or New South Wales governments should create a mandatory public register of all such properties. At present, privacy trumps transparency and unless the property owner self identifies or a selling agent answers truthfully, it is impossible for a buyer to ascertain that information.
The rationale for such a regime would not be to name and shame, but to help protect bona fide buyers from sham sales campaigns whose object is to solicit low offers from the market so as to minimise stamp duty before ‘selling’ a property to a pre determined related party to satisfy any divestiture order or other pre-emptive moves in advance of FIRB action.
(E) The Baird NSW State Government
In just under two years since becoming Premier, Mike Baird’s government has overseen more property related reforms, infrastructure projects and planning initiatives than any other NSW State Government in living memory.
While many of those projects and planning initiatives flow from the Plan for Growing Sydney, others do not which contributes to the impression of a government prone to ad hoc decision making; the suggestion that light rail might now be extended to Botany Bay being one of the most recent examples.
Some initiatives have been positive. Others do not go far enough.
Many others have been controversial and raise long term social and urban planning issues such as the future of car transport, provision of public schools, the desirability or otherwise of dense high rise living, cycling, the loss of diversity as a result of decentralising affordable housing and the sale of iconic public buildings.
Others are a work in progress on which property buyers and owners should keep a careful eye. These include the forced merger of local councils, the continuation or not of 1.30 am lockout laws in parts of the City and the suggestion stamp duty be replaced by an ongoing annual land tax; the latter being an idea which recently crept into the dialogue and did so at the same time as the Baird and Turnbull governments consider ‘value capture’ as a way of cashing in on the (now past) property boom to help pay for future infrastructure projects.
In other respects, this State government has not gone far enough implementing reforms.
As a detailed discussion of all such topics is also beyond the scope of this article, we confine our attention to aspects of some of them which are of particular interest to property buyers.
(E1) CBD and South East Light Rail project
Despite the highly controversial and wrong headed destruction of 130 year old trees along its route with more to be removed, the CBD and South East Light Rail project is still seen as a positive by most property buyers and for at least 18 months has buoyed activity in Kingsford, Kensington, Randwick, Surry Hills and East Redfern. The response was the same across town before the Inner West Light Rail Extension opened two years ago.
However, a word of caution: just as the State government has given, so it might take away.
The dense urban infill preferred by the government is already exposing capacity problems along the Inner West Light Rail Extension between Central and Capitol Square to The Star Casino. More congestion along the rest of that line is likely when high density developments in Darling Harbour, Lewisham and Dulwich Hill are completed.
We understand from reliable sources that an underestimation of demand on the Inner West Line is notorious in some quarters and that increasing the frequency of trains is constrained by the existing power supply.
Whilst we do not know whether or not the same might be the case with the CBD and South East Light Rail project, recent statistics released by the NSW Department of Transport suggest that congestion as experienced on the Central Coast and other outer suburb heavy rail lines may be the cause of substantially reduced patronage on those lines.
If so, not only may property buyers between Surry Hills and Kingsford wish to curb some of their enthusiasm given the vast number of medium to high density developments under construction and planned between and in those suburbs, governments may also find themselves with less ‘value’ to ‘capture’ than hoped.
(E2) Sydney Metro railway project
This project will bring long overdue public transport to the growing north west of Sydney and to train deprived Crows Nest whose existing popularity with buyers is likely to increase further when the project is completed. Those parts of Alexandria and Redfern which are more than an easy walking distance to existing train stations at Redfern and Green Square may also benefit from the proposed Sydney Metro Station at Waterloo but attractive pockets of Alexandria’s Golden Triangle near Alexandria Park may actually be too close to that underground station if it is built where planned between Botany Road and Cope Street to the south of Raglan Street.
(E3) Barangaroo Reserve and Millers Point
It is difficult not to be enthusiastic about the opening of the Barangaroo Reserve on 22 August 2015.
However, this is a precinct where some of the issues we have been discussing directly converge. On the one hand, it has seen the creation of a major public space which is a vast improvement on what existed. On the other, it has seen a substantial loss of public housing from the city centre and the creation in its place of a Sydney sub market where the astronomical prices being paid by buyers may partially explain why Millers Point has already found its way on to the NAB’s ‘black list’ discussed earlier.
(E4) The 75% rule – a possible threat to smaller and well located blocks
On 28 October 2015, the State Government approved several reforms to the strata titles legislation; the most controversial of which being to permit the termination of strata schemes with the approval of only 75% of owners rather than the previously required 100%.
One of the principal justifications for this change was to prevent owners from obstructing the re development of ageing strata buildings.
Although this reform was accompanied by safety measures overlooked by some strident critics, it is an initiative which, if accompanied by increased land tax even on the principal place of residence, could incentivise a push towards greater density, including the replacement by high rises of those buyer preferred smaller and well maintained strata blocks sitting on well located land with generous curtilages.
(E5) Underquoting Guidelines for Residential Properties and a need for more reform
Since coming into force on 1 January 2016, the requirement under the new Underquoting Guidelines for Residential Properties (the Guidelines) that revisions to the estimated selling price be advertised to the market as soon as practicable is proving to be a step in the right direction.
However, the Guidelines should have gone further.
Apart from another useful requirement that in any advertised price range the highest price not exceed the lowest price by 10%, the Guidelines still allow selling agents a lot of wriggle room in the lowest price advertised at the beginning of a sales campaign which is often when, in the hope of not missing out, many buyers who still fall for underquoting waste resources on building, pest and strata inspections.
If the government wanted to make even more meaningful reforms in this area, it should reverse the onus by obliging selling agents to show reasonable cause why the first advertised price or range was more than 10% higher than the eventual price. If competent buyers’ agents and well researched buyers can predict the latter well before it occurs, selling agents surely can do likewise.
It is also regrettable that the government did not take this opportunity to align the property market with the more transparent equities markets by outlawing the practice of keeping sales prices confidential and by making it mandatory for buyers’ and selling agents to report in real time all sales results to a central agency.
A continuous disclosure requirement such as the latter would be less onerous than some of the new record keeping obligations contained in the Guidelines including the requirement, punishable by a possible $22,000 fine, that ‘a real estate agent who makes a statement in the course of marketing a residential property to a buyer, potential buyer, seller or potential seller that the property is likely to be sold for a specified price or within a specified price range must make a written record of the statement which contains the address of the property concerned, the price or price range, the date and time of the representation as well as any other information that is prescribed by the regulations’.
As we have proposed many times before, such an initiative would massively improve the reliability of unadjusted auction clearance rates which remain one of the most influential metrics.
Three things need to be understood about the unadjusted auction clearance rates published each Sunday by APM.
First and this is a popular misconception, they do not measure the percentage of properties that were listed for sale which sold either at or prior to auction. Ie: Sold at auction + Sold prior/ Listed for auction.
The denominator in such a hypothetical formula would be an objective figure over which selling agents have no control.
Rather, the published auction clearance rates measure the percentage of a percentage; namely the percentage of properties which sold either at or prior to auction of the percentage listed for sale which selling agents choose to report ie: Sold at auction + Sold prior/ Percentage reported by agents + Withdrawn from Sale.
The denominator is therefore a subjective figure over which selling agents have complete control.
Second, selling agents are under no obligation to report their results.
Third and understandably flowing from the second point, selling agents have more incentive to report sales rather than non sales.
It follows from the above that the unadjusted clearance rate is far from a random sample. Instead, it is an inherently biased snap shot.
That bias is not such an issue if the market is unarguably running hot as was the case from 7 February 2015 until 1 August 2015 when, as mentioned, the weekly unadjusted clearance rate averaged 84.5%.
The average weekly reporting rate during that period was 79.2%; rising to 86% on 7 February 2015 as selling agents rushed to report their successes and creating a large sample in the process.
The real bias in this metric is exposed where, as now, the market is correcting which in turn, triggers the incentive to suppress the extent of that correction by not reporting results.
The result is that the sample size reduces so increasing the bias and the unreliability of this metric on which so many rely including the Reserve Bank of Australia whose Minutes regarding the official cash rate expressly refer to such figures (most recently on 2 and 16 February 2016).
When the average weekly unadjusted clearance rate fell to 74.6% between 1 August 2015 and 26 September 2015, the average weekly reporting rate fell to 76 %.
During the period of steep correction between 30 October 2015 and 19 December 2015 when the weekly unadjusted clearance rate averaged 61% %, the average weekly reporting rate fell to 63.8% and even went as low as 58% on 28 November 2015 – a far cry from the 86% reported on 7 February 2015.
The disturbing correlation between these two percentages is clear from this graph:
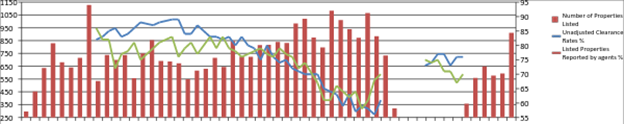
Source: APM. (Note that the break in reporting reflects the closure of the auction market over the Christmas holiday period.)
(E6) WestConnex
As the most controversial of the initiatives, this massive toll road project has attracted widespread criticism.
Given overseas trends against the building of major toll roads, the dubious viability of many past local toll road projects and this government’s embrace of public transport, its determination to build WestConnex seems anomalous.
In broad terms, the project will extend the M4 and link it to the M5 via a series of roads and underground tunnels passing beneath several city inner western suburbs. Exits and interchanges are to be built in Haberfield, St Peters and as recently announced, in Camperdown near Sydney University as well as Rozelle and Lilyfield where a future road tunnel to North Sydney is intended but about which, little is known.
All of that infrastructure is somehow to be accommodated and co-ordinated with the government’s planned urban regeneration of the Bays Precinct in the same area.
Adding to the anomaly is the fact that the despite its name, WestConnex does not in fact ‘connect’ the west to the city. Instead, it appears that any city bound extra traffic entering the proposed Rozelle interchange will be carried by the existing Anzac Bridge which over the longer term may, paradoxically, contribute to the inner west being disconnected from the Sydney city.
Recently leaked government traffic forecasts suggest that WestConnex will not reduce the number of cars expected to discharge into already congested streets in St Peters, Newtown, Erskineville and Alexandria and that at best, it will only slow the rate at which congestion would increase without WestConnex as a result of the many high density projects in and around Green Square, Zetland, Rosebery and Waterloo.
In other words, that WestConnex will make the existing grid lock ‘less worse’ than it could be. Some may consider this to be a modest performance hurdle for a project with an estimated cost of $16.8 billion.
In addition to the resumption of properties, fierce local opposition in those inner suburbs has also focused on the risks of increased traffic congestion, air pollution from exhaust stacks and the alleged carting of contaminated spoil through high density suburban streets.
Doing the best we can to retrieve the comparative weekly clearance rates for each of three regions over the first and last quarters of the last 2.5 years, we have plotted three graphs.
Prior to the controversy erupting, the Inner west was the unarguable powerhouse of all Sydney regions with auction clearance rates usually exceeding its two nearest rivals, the City/Eastern suburbs and Lower North Shore as this sample shows:
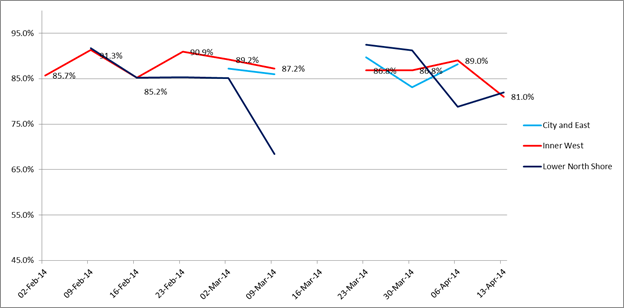
Then there was a sharp correction coinciding with controversy surrounding WestConnex and no other event:
After which, the Inner West went from the leader to laggard:
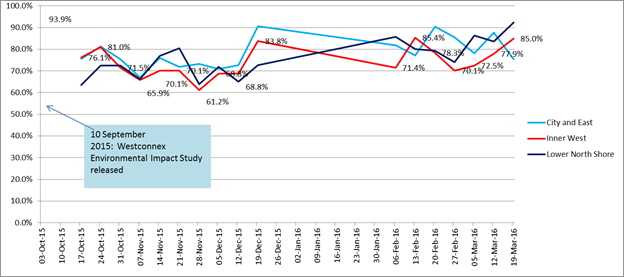
Sources: APM
For buyers in suburbs such as Strathfield, Burwood and Concord who might benefit from the M4 East section by passing Parramatta Road, WestConnex could be a boon.
For others buying closer to the city, it is a source of major risk that needs to be researched carefully before purchasing any property.
Being on the City side of Anzac Bridge and apparently not affected directly by Westconnex and its associated infrastructure, Glebe, Pyrmont and Ultimo may prove attractive buying suburbs for committed inner west buyers particularly if, as also mooted, Sydney Fish Market is refurbished and Wentworth Park as well as the southern foreshore of Blackwattle Bay are reinvigorated as attractive public spaces.
For buyers in suburbs directly affected by likely traffic congestion but satisfied with a ‘less worse than it would be’ outcome, the present market may be an opportunity to make a counter cyclical acquisition.
(F) Another Australian Prime Minister
To the relief of many, Malcolm Turnbull replaced Tony Abbott as Prime Minister on 15 September 2015.
It would seem from the above however, that this latest change of Prime Minister had little effect on Sydney property buyers.
Whereas the Opposition has committed to reforming negative gearing if elected, the Coalition’s flip flopping since Christmas generally and on the topics of City building and Commonwealth funding for infrastructure as well as schools, makes it difficult to assess the future influence it may have on Sydney’s property market.
At the time of writing, eyes are on the Federal budget which was been brought forward to 3 May 2016 as a prelude to a double dissolution election. If that happens and history is any guide, the ensuing long election campaign will contribute to a sombre Sydney property autumn.
Conclusion
Some say that buying in a declining market can be like catching a falling knife. While the blade in Sydney became longer in the last few months, so too, for the well researched buyer, did the handle.