The missing ingredient in house-price indexes
September 26th, 2016
Do we really know as much as we should about what’s going on in the Sydney property market and in other Australian property markets? In this 23 September 2016 Australian Financial Review article written by Jacob Greber and Michael Bleby, Chris Curtis is scathing about the quality of information in those markets:
Property. It’s the nation’s biggest asset class by a vast margin. Nothing else comes close.
During the June quarter, for the first time in history, it cleared the $6 trillion mark, making it three and a half times larger than the sharemarket and far bigger than the $1.8 trillion currently sitting in superannuation accounts.
As of today, the value of housing is equivalent to almost four times the measured value of the entire economy.
Yet for all its size – and the daily national obsession with its winners and losers – do we really know as much as we should about what’s going on in the property market?
Chris Curtis, a Sydney buyer’s agent who has acquired hundreds of millions of dollars of property on behalf of clients over the past 10 years, is scathing about the quality of information in the market more broadly.
Primary problem
He says the primary problem is that much of the raw information – including heavily reported weekend auction results – is provided to research companies by people within the real estate industry, primarily agents who have “a vested interest in one side of that transaction and in conveying the impression of a consistently buoyant market”.
“There is an inherent conflict of interest among these data providers. They hold back sales reported weeks ago to maintain the sense of market buoyancy,” he says.
“Agents who have had a bad day don’t report their results, so you don’t get accurate reporting rates on auctions.”
Concerns about house-price methodologies are nothing new.
In 2005, the Reserve Bank of Australia created its own house-price index in conjunction with Australian Property Monitors (now the Fairfax Media-owned Domain) out of concern about the timeliness and reliability of ABS data. This is the stratified median index now used by Domain today.
The ABS has since revised its index and as the purveyor of “official” housing-market information it is regarded as authoritative.
However, the collection of a wider pool of data takes time, and the ABS figures lag those of private sector providers CoreLogic and APM/Domain. In the house-price data game, there is a trade-off between speed and accuracy. The longer the time period measured, and the more speedily it is produced, the more reliable the numbers.
Auction clearances
In a property-obsessed nation hungry for new information, the attraction of auction clearance rates is clear. They give a readout on a weekend’s results the next – or even same – day, and proponents say they are worth it, despite their shortcomings.
Auctions account for a minority of properties sold in a market and even in Melbourne, the country’s auction capital, they only make up about 30per cent of sales. In Sydney they’re about 25 per cent. In Brisbane the figure is less than 15 per cent and in Perth it’s under 5 per cent. Auctions generally take place in more expensive suburbs, where there is more competition for properties – as can be seen in Sydney’s eastern suburbs, the epicentre of the current property boom.
“It’s more slanted to higher-end properties,” says CoreLogic head of research Tim Lawless. “It reflects what’s happening in premium markets.”
And while auction clearances give an up-to-date snapshot in that market – such as Sydney’s inner-ring suburbs, where low stock levels and cheap borrowing costs are driving prices and clearances higher – they may not tell the whole picture.
Auction prices and clearance rates are just one piece of the much larger housing market puzzle which includes vastly more information from private treaty sales, which the index providers also rely on.
Out of all the noise the RBA tries to evaluate what’s happening to pricing and inflation across the housing economy. The accuracy of the information is critical; it’s a major part of the process by which the bank decides what to do with interest rates. In a delicately poised economy a wrong call has serious implications.
“It’s not in our society’s interests for house prices to rise faster than incomes,” newly minted RBA governor Philip Lowe told Parliament’s economics committee on Thursday.
“That corrodes [the] health of our balance sheets.”
Data confusion
But the central bank, like ordinary punters, faces a confusing array of data signals on the housing market. While there are many different sources of data, none of them are perfect. Nor does the RBA only rely on data – it talks widely to people in the markets and makes its own estimates of what is happening to asset prices, including property.
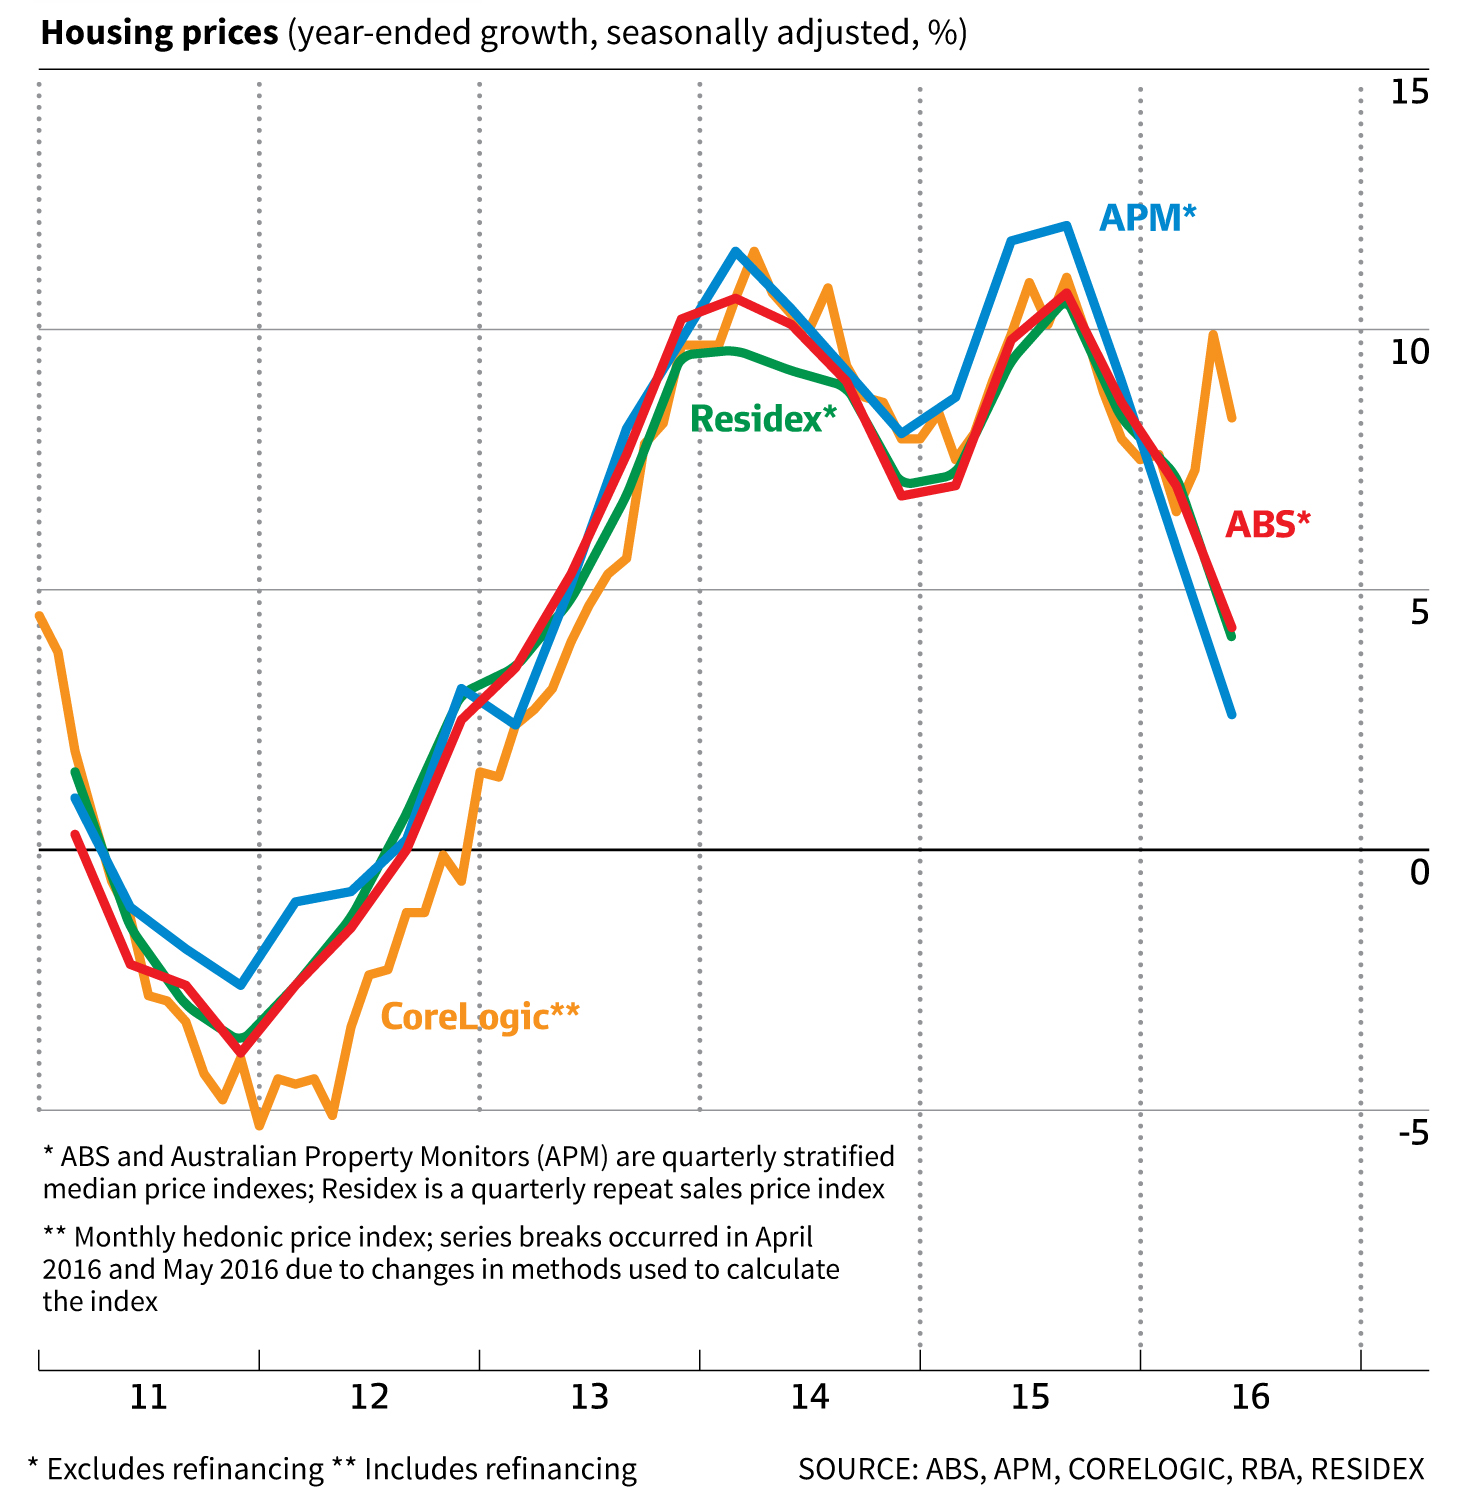
But when it comes to the business of property data, each source has its shortcomings and they sometimes appear to send different messages of what’s going on. This week, for example, the Australian Bureau of Statistics reported housing prices across Australia rose 4.1 per cent in the June quarter from a year earlier. In July, when CoreLogic put out its equivalent numbers, it gave a figure of 8.3 per cent – apparently more than double the ABS number. Domain, which doesn’t give one figure for the housing market overall, painted a different picture yet again, with a sedate 2.7 per cent rise in houses and a near-comatose 0.1 per cent gain for units.
These measures are a weighted average of capital city performance. But taking a more specific measure, such as price growth in one city, Sydney for example, gives sharply diverging figures.
The ABS says Sydney prices rose 3.6 per cent in the year to June, with houses up 3.7 per cent and units 3.2 per cent. Domain says Sydney houses increased 1.2 per cent and units just 0.4 per cent. CoreLogic clocked an 11.3 per cent rise for Sydney overall, with houses shooting up 11 per cent and units 12.8 per cent.
The difficulty is that the housing market is a tough thing to value. Dwellings aren’t the same – unlike a more homogenous product like cars or fridges – and the prices paid for them are often the result of subjective decisions by human beings. Every house is different and every buyer and seller has a different agenda or set of priorities that guide their behaviour.
Fundamentally different assumptions underpin how the market is measured. The ABS and Domain use a process called “stratified median”, in which dwellings are sorted into certain baskets – or strata – according to characteristics such as media sale price and socio-economic profile of the suburb (and other data drawn from the census, in the case of the ABS), to derive a median price for each stratum. The different strata are then combined to come up with a median price for the market as a whole and changes in that median price are the basis for the reported house-price movements.
In contrast, a so-called hedonic index, such as the one produced by CoreLogic, look at a city’s (or region’s) housing stock as a whole and comes up with a value for that total portfolio of housing. The model, designed by former Rismark International director, and now AFR Weekend columnist, Christopher Joye, imputes the value of every single dwelling and measures changes in that value index to indicate what prices are doing.
It’s a far more data-heavy process than the others, taking apart the different elements of a property and assigning a value to them. For example, if it’s a three-bedroom house
on a 600-square-metre block, the model will value each of those aspects. Thoses variables – and others, such as time on market – are used to adjust reported sale prices – both auction and private treaty.
Done properly, hedonic models are the gold standard of house-price measurement. However, they are underpinned by a number of assumptions – such as values ascribed to certain attributes – that are not always clear. A tweak in the underlying algorithms – akin to changes Google makes to its search engine – can significantly alter the results it comes up with and the picture may not be clear to outsiders. And then there is the issue of how open a data provider is.
Openness issue
This drawback was clear last month when the RBA called out CoreLogic for having “overstated” housing price growth. It turned out the housing provider had indeed tweaked its model without telling some key parties – including the RBA – to adjust the way it accounted for extremely high- and low-priced property sales. The change meant it exaggerated the vigour of strong markets like Sydney and Melbourne – and inflated the aggregate increase – and also overstated the weakness of a soft market like Perth.
CoreLogic said it would restate its index to account for the change, but it hasn’t yet done so. It declined to supply the AFR Weekend with an estimate of the impact of the restatement. The change affected its figures in April and May, so it will only be from June 2017 – by when April and May 2016 have dropped out of the equation – that CoreLogic’s annual price growth figures won’t be affected by the distortion.
By contrast, the inner workings of a public provider like the ABS are open for all to see, but the drawback here is speed. The ABS numbers for June came out a week after Corelogic’s daily index had already given indications to mid September.
But critics say measures as short term as a daily, or even monthly, index don’t give a clear picture of reality.
“They may reflect what’s happening [on a] daily basis,” Domain chief economist Andrew Wilson says. “But that’s not reflecting what’s important. It’s the underlying noise that’s what we’re looking for. Monthly data sets are notoriously volatile. They don’t reveal the underlying noise.”
Corelogic’s Lawless says the daily index gives a previously unavailable insight. “A daily index does show volatility from day to day, however it also provides an opportunity to measure intra-month changes in housing markets. The frequency of timeliness of the hedonic index is one of its key benefits.”
The company says its methodology is better able to iron out distortions than a more simple system such as stratified median. The data business is a serious game, particularly for a player like CoreLogic that has an eye on producing numbers that could underpin a publicly traded instrument. It already publishes monthly numbers designed for that very purpose.
“There maybe some interest in a tradeable environment,” says Lawless.
Continuous reporting
If there’s the scope for confusion between numbers at the high end, it’s little wonder ordinary buyers are scratching their heads. For a buyers’ agent like Curtis, the weakness of auction clearance numbers are problematic because they only reflect the results of sellers’ agents who chose to report.
He advocates a continuous reporting obligation on agents and solicitors, which he says would be no more onerous than regulatory burdens they already face, such as NSW rules that require a selling agent to note each time they tell a potential buyer a price.
The evolving world of property data may make such a change unnecessary as other real-time indicators become available. SQM Research already produces an index of sellers’ asking prices and Domain has a nascent one it is developing. While there’s inevitably a gap between asking and final prices, they are a very accurate real-time measure of market sentiment and direction. Further, they are a way to track the much larger market of homes sold by private treaty that are not covered by auction clearance figures.
“If you need a timely index, asking prices are the best as opposed to a prices index we know is lagging,” SQM managing director Louis Christopher says.