The Sydney residential property market over $1.5 million. Nobody much feels like dancing
April 30th, 2012
Following the near disappearance of the Euro debt crisis from the headlines and anecdotal evidence of increased activity and auction clearance rates associated with a likely drop in the official cash rate, it seems like an ideal time to assess the impact of the past 12 months of turbulence on the Sydney housing market above $1.5 million by comparing a snap shot of this month’s activity against the same month last year.
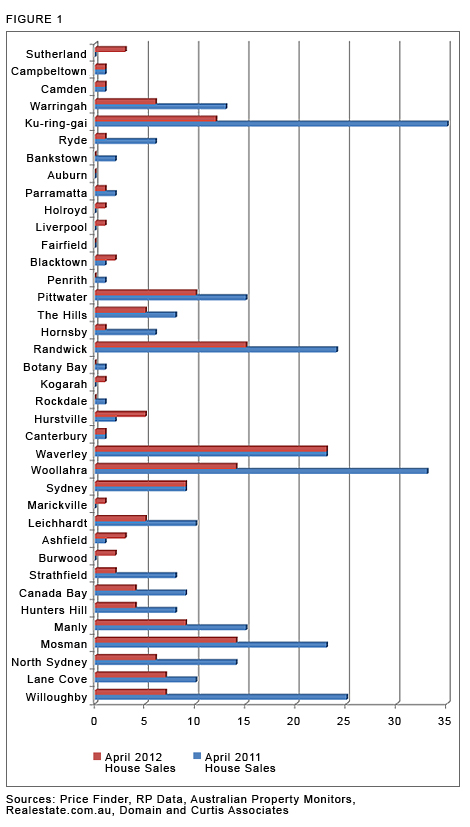
The results for all reported house sales over $1.5 million in every Sydney Local Government Area (LGA) are presented graphically in Figure 1.
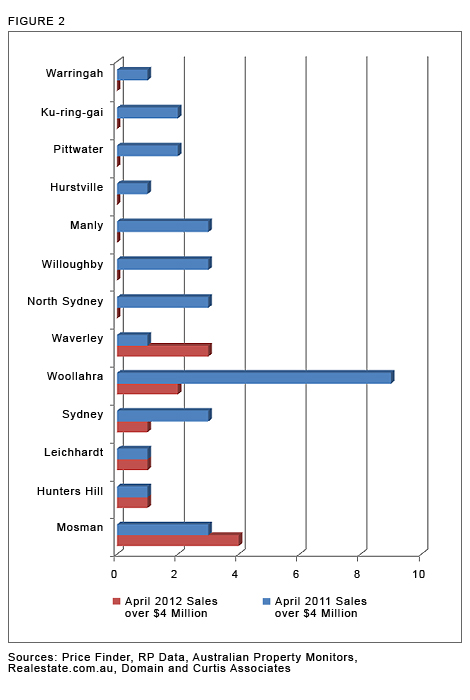
Figure 2 presents the sub – set of house sales over $4 million in every Sydney LGA.
This analysis excludes apartment sales as volumes over $1.5 million in each of the two months being considered were statistically insignificant – itself a telling statistic.
The results shown in each Figure paint a more accurate picture of the current state of Sydney’s top end residential property market than is conveyed by other and more glib mainstream commentary.
Summarising:
- For sales over $1.5 million, volumes this month across all LGA’s were an alarming 43% lower than in April 2011
- Over $4 million, the reduction in sales volumes between each of those two months was 64%
- Consistent with the views discussed in CurtiseCall March 2012:
- In April 2011, Mosman accounted for a mere 10% of all reported house sales over $4 million whereas in this month, that percentage had increased to 33%
- In that move, Mosman stole the mantle from Woollahra with the latter LGA in April 2011 accounting for 27% of all house sales over $ 4 million but only 16% of such sales this month
- Mosman was one of only two Sydney suburbs to record an increase in sales volumes over $4 million this month compared to April 2011
- The other LGA in the latter category was Waverley which, having recorded 23 sales this month and in April 2011 over $1.5 million , was also and clearly the most resilient of all LGA’s in the 2012 Sydney property market
- Although recording only nine house sales this month over $1.5 million, Sydney was the only LGA other than Waverley to record no reduction in volumes between this month and April 2011
- The next most resilient LGA’s over $1.5 million and their respective reductions in sales volumes between this month and April 2011 were Lane Cove (-30%); Pittwater (-33%); Randwick and The Hills (-38%) and Mosman (-39%). It is reasonable to attribute part of the reduction in The Hills to the Federal Government’s announcement this month that it would not provide funding for the North West Rail Link
- The least resilient LGA’s over $1.5 million and their respective reductions in sales volumes between this month and April 2011 were Ryde and Hornsby (-83% each); Strathfield (-75%); Willoughby (- 72%); Ku-ring-gai (-66%); Woollahra (-58%) and North Sydney (-57%)
- Except for Ashfield and Marrickville, those LGA’s in which increases in sales volumes were recorded were all in the middle and outer ring suburbs of Hurstville, Burwood, Blacktown, Sutherland, Holroyd, Liverpool and Kogarah. That said, between them, those nine LGA’s managed this month to achieve only 14 sales over $1.5 million and none over $4 million
- In a clear example of just how risky and perplexing the Sydney property market can be, there was no pattern to the variations between LGA’s and any attempt to analyse these trends according to regions such as the eastern suburbs and inner west is forlorn. The poorly performing Willoughby LGA is contiguous with the resilient Lane Cove LGA; North Sydney is contiguous with Mosman; Strathfield with Burwood and the stand out Waverley and Sydney LGA’s are each bounded by the poorly performing Woollahra LGA
And the explanation for these trends?
As the following table shows, it seems to have little to do with other economic indicators such as interest rates or stock market gyrations. Similarly, the farcical side show otherwise known as Federal politics is suspected by this article to have as little to do with these trends as the imminent Federal budget and carbon tax.
| April 2012 | April 2011 | |
|---|---|---|
| Reserve Bank of Australia Interest Rates | 4.25% | 4.75% |
| Official Inflation Rate | 1.5846% (March 2012 Qtr) | 3.3333% (March 2011 Qtr) |
| AUS $ to US$ exchange rate | 1.0453 | 1.0900 |
| Unemployment rate | 5.1% | 4.9% |
| ASX All Ordinaries | 4467.2 | 4899.0 |
Sources: ABS, RBA, ASX, Trading Economics
As discussed in CurtiseCall December 2011, this article continues to believe that the answer lies in the animal spirits aroused by the continuing uncertainty surrounding the global economy and Europe in particular. For most owners who do not have to sell (being the vast majority), their property asset(s) represents a safe haven in an uncertain world. Except for opportunists sensing bargains to be had in suburbs such as Mosman, buyers and potential buyers are also content to wait on the sidelines until the uncertainty passes as inevitably, it will. Even the bargain hunters would be surprised at the slimness of quality pickings in Mosman over $1.5 million.
Finally and for completeness, the trends this month had nothing to do with the dates on which Easter fell. In 2011, Good Friday fell on 22 April whereas this year it fell on 6 April.